Which way off the knife edge?
A note on the craft of polling. Don't mistake judgment for "herding"
(A cross-post from the Princeton Election Consortium)
After all the canvassing, donation, and activism, tonight we observe.
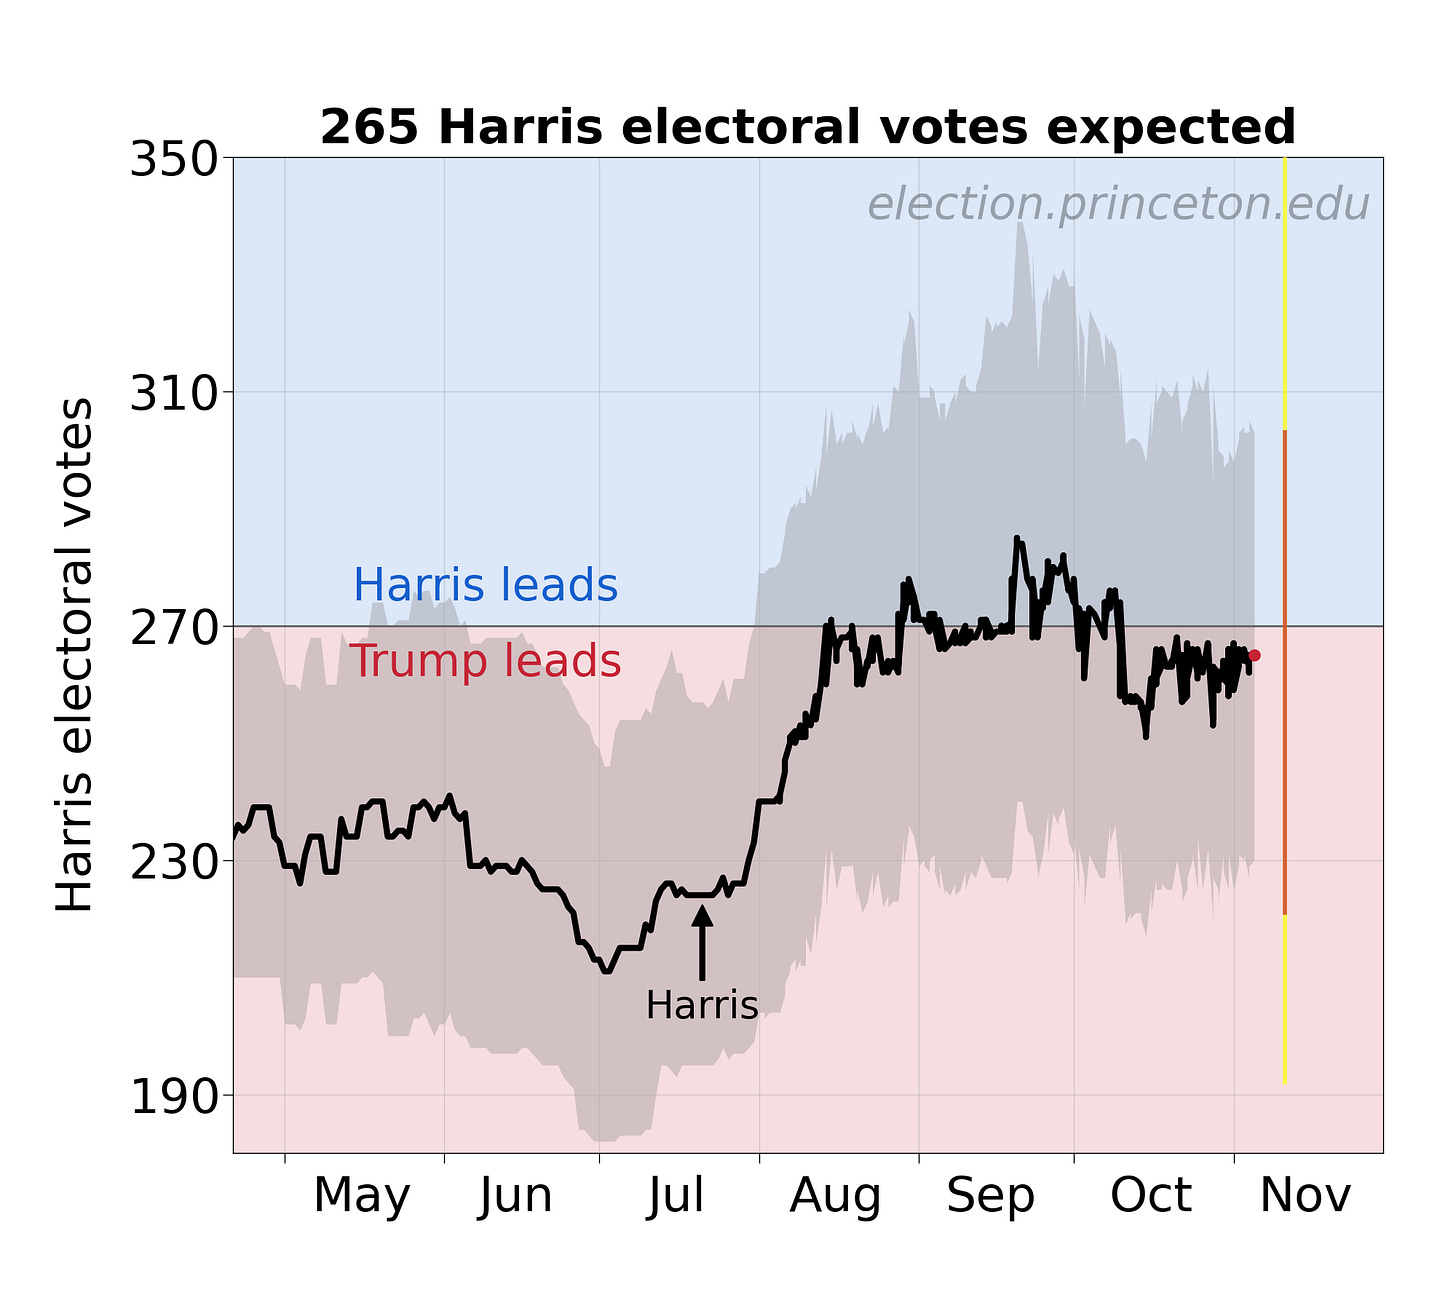
Before I switched focus to electoral reform a few years ago, I developed poll aggregation. That occurred in 2004, one of the first years when enough data became available to put them all together statistically. Later this activity became more complex, with the rise of FiveThirtyEight.com. I still use simpler methods than they do, but they are still statistically rigorous. These snapshots, which you can see at the Princeton Election Consortium, give very similar answers. But they do more: they help citizens allocate their individual efforts.
Here, a few notes on what that polling analysis is telling us. Later today I will provide a guide for what to watch tonight to tack national power, state power, and what comes next for our rickety democracy.
Reweighting can be mistaken for herding
There’s talk about how pollsters are watching each other, and coming up with results that don’t get too far out of line with the average. This is called herding.
In my view herding is somewhat overblown, and not to be confused with expert judgment. It is hard to tell the difference, but I would caution against impugning the craft of how one generates a good survey sample.
Pollsters face the problem of identifying who will vote, and normalizing their sample to match. If some demographic of people is disproportionately likely to answer a survey, more often than they would vote, then pollsters have to weight those responses appropriately. This is a matter of judgment.
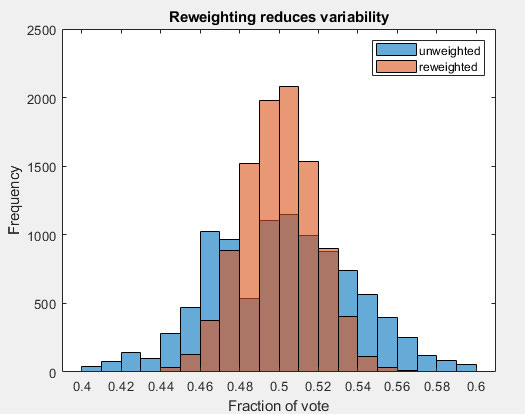
As it turns out, re-weighting reduces variability. Here is an example.
Imagine 3 groups of voters, distributed as 45% Democratic-leaning, 10% independent, and Republican (45%). They vote for the D candidate with probability 0.9, 0.5, and 0.1 respectively.
Below in blue is the raw result of 10,000 simulations of samples from this population (my MATLAB script is here). The results are pretty spread out.
In red are the same results, reweighting the sample with prior known proportions of the voter population. Reweighting narrows the apparent result. Pollsters reweight by more variables, and these various weightings (sometimes it’s called raking) will narrow the distribution further. This is just what pollsters do routinely.
The judgment comes from knowing what weights to use. Every pollster has their own set of weights that they use. Poll aggregation collects the crowd wisdom of these pollsters. In the aggregate, they will still be off – that is called systematic error.
How much will the systematic error be this year? In 2026, it was about 1.5 points, leading to a surprise Trump win. It would not be crazy to imagine an error that large in 2024. But in which direction, I don’t know.
Which way will events fall off the knife edge?
Based on past analytics at the Princeton Election Consortium, the systematic error is likely to be much larger than the virtual margin of the presidential race. By “virtual,” I mean a definition of the margin not in terms of popular vote, but in terms of how far the race is from a perfect electoral tie. I calculate this “meta-margin” as Trump +0.3%. In other words, if polls were off by just 0.3 percentage point, we would have an absolutely perfect toss-up in the Electoral College, with an expected Harris 269, Trump 269 electoral-vote outcome.
The likely systematic error, 1.5 points, is much larger than this meta-margin. This has two implications:
We don’t know who’s going to win based on polls alone.
The final outcome is highly likely to be less close, in one direction or the other.
But which direction will the outcome fall off this near-perfect knife edge?
Later I will give evidence supporting the idea that the systematic polling error will end up favoring Kamala Harris, as well as point toward Democratic control of the House of Representatives.


You're always informative, SW. Thanks.