

The Worst 10 Gerrymanders Ever
...including Texas and California, which propose to draw the first 5-seat partisan gains in the modern age

At the Electoral Innovation Lab, we've applied metrics of fairness to identify the worst partisan gerrymanders of the last 50 years. You’re not going to believe where the new Texas plan comes in. (Actually, I think you will believe it.)
We chose 50 years as the time scale because in 1972, legislatures had to start drawing Congressional districts to be of equal population, thanks to the 1964 Supreme Court ruling (Reynolds v. Sims) mandating the "one person, one vote" principle. (Legislative districts also have to be of equal population to one another, but we're not analyzing those here.)
To make a clear comparison, we've focused on metrics based on statewide vote share. This is similar to what I did in my original 2013 piece on the Great Gerrymander of 2012, my 2016 Stanford Law Review article on three tests for gerrymandering. Statewide tests also form a major component of the Princeton Gerrymandering Project report card. In all cases, the concept is that it’s possible to estimate how many “extra” seats come from partisan line-drawing, above and beyond what neutral principles would produce.

It's important to note that this measure does not capture everything. It doesn’t explicitly take into account the political geography of where voters live. However, those effects tend to be rather small. If you look at the Princeton Gerrymandering Project, the “fair range” based on statewide vote and computer simulation overlap, leading to similar results for current maps, as you can see over at PGP.
A second factor we’re leaving out today is the Voting Rights Act. Currently, the VRA requires fair representation of Black, Hispanic, and Asian communities. Drawing maps to comply with these requirements can often lead to representation that deviates from what a vote-share-based analysis would produce. Generally, consideration of race tends to bring a plan closer to proportional representation. We decided to leave out consideration of the VRA. However, by the end of this article, you will see what happens when it is disregarded.
Finally, we've left out a number of plans that were drawn by state courts. State courts usually draw maps that are pretty balanced between the two parties. When they deviate, it is often because of VRA requirements or other factors. Because of the complexity of court cases, we have left them out of our analysis.
We will soon be issuing a full report on these findings (mathematical methods are here).
In the meantime, without further ado…here are the top 10 worst partisan gerrymanders of modern times.
#10, #9, and #8: Florida, Michigan, and Virginia - 2 seats each, multiple decades
These three states are multiple offenders. Over and over again, the legislative majority carved out two additional seats compared with what a neutral process would produce. But it wasn't always the same party doing the carving.
In Florida, Republicans have succeeded in getting two extra seats for themselves twice: first in 2002 and again in 2012. But they were not the only ones to do this—Democrats also did it back in 1972 when they dominated state politics.
Interestingly, the current Florida Congressional map does not look as extreme as those old gerrymanders. The reason is that Florida has been trending Republican, voting 58% Republican, 42% Democratic in 2024. Under those conditions, a delegation of 20 Republicans and 8 Democrats can arise naturally.
In Michigan, the story is simpler. Republicans controlled redistricting in 2002 and 2012, and in both cases carved out two additional seats for themselves. However, the Michigan gerrymander of 2012 was not done as artfully as it could have been. After several cycles, it eventually failed as voting patterns around the state shifted. By 2018, the Michigan gerrymander had given way to a more equitable distribution of seats. In some sense, this could be considered a "dummy-mander" because it did not hold for the entire decade.
Finally, we have Virginia, whose Republican-controlled legislature drew a gerrymander that gave them two additional seats in 2012. Both Democrats and Republicans did this in previous decades. But the 2012 Virginia gerrymander is special because it triggered positive reform. After Republicans drew the congressional map, they realized to their consternation that they might lose partisan control of government to Democrats due to demographic shifts. They therefore had a "come to Jesus" moment in which they developed an interest in nonpartisan redistricting.
A combination of citizen and bipartisan political efforts led to the establishment of a commission that partially took the power of redistricting away from the legislature. This commission is composed of both citizens and legislators. It's not perfect—in 2021 it deadlocked and threw the whole process into the Virginia Supreme Court. But that court did a bang-up job of drawing a fair map, appointing special masters Bernie Grofman and Sean Trende, nominated by Democrats and Republicans respectively. They drew a remarkably balanced map that, in our estimation, has no bias in either direction.
To read more about Virginia’s remarkable move toward fair districting, read this account by the Lab’s Zachariah Sippy and me.
#7, #6, #5, and #4: North Carolina (R), Ohio (R), California (D), and Illinois (D) - 3 seats each
The difficulty with reviewing 50 years of gerrymanders is that inevitably there are multiple specimens. In this category we have four distinguished winners, two drawn by Republicans and two by Democrats.
Two gerrymanders in this category were part of the Great Gerrymander of 2012. In 2012, Republicans gained control over redistricting in half a dozen legislatures. Because of that, and because of the increasing separation between the parties since the mid-1990s, they were motivated to draw an amazing array of gerrymanders. It was a high-water mark, leading to a net 20-seat advantage for Republicans. Before and after that, the advantage has never been more than 9 seats for either party.
The two Republican gerrymanders in this category were in North Carolina and Ohio. In North Carolina, the governor lacks a veto, so the legislature was left to its own devices. They drew a map that turned a 50%-50% statewide vote into a 10 Republican, 3 Democrat delegation. Ohio Republicans drew an equally extreme map. See my deep dive here.
The more famous Democratic offense took place in 1982, when political boss Phil Burton directed what at the time was considered an egregious offense: squeezing out multiple additional seats for Democrats. It is cited to this day as an example of Democratic overreach. This gerrymander was infamous because it came just 10 years after the introduction of the "one person, one vote" standard. Using our methods, it was a net three-seat gain for Democrats.
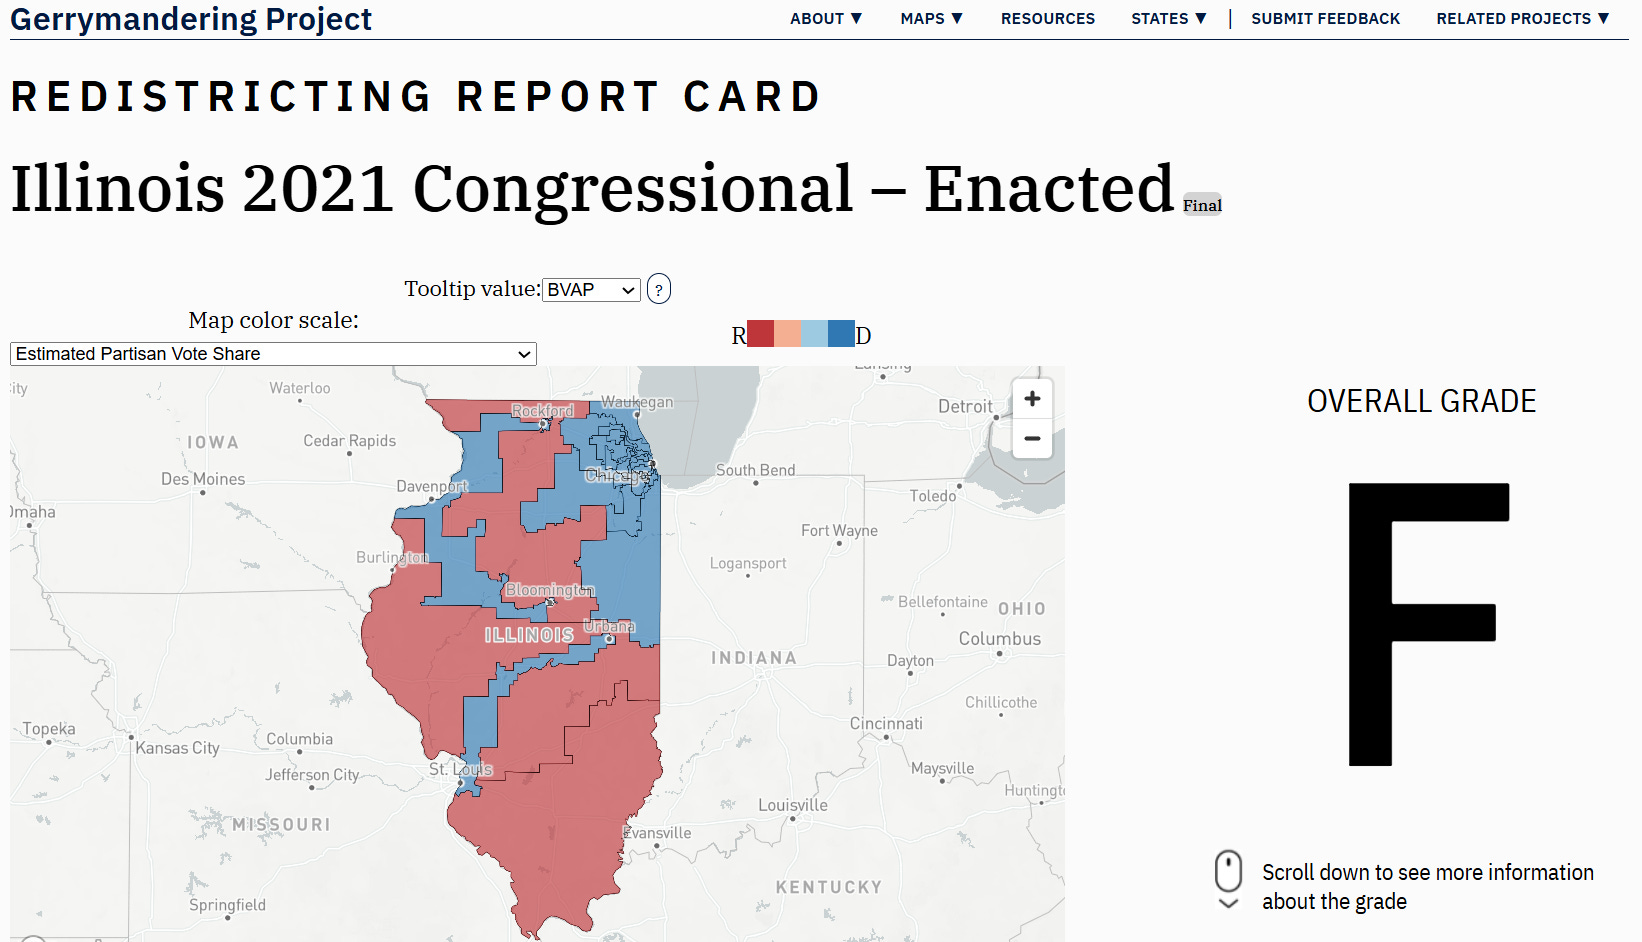
A similar offense is in place today. It was drawn by Illinois Democrats, whose current Congressional map elects 14 Democrats and 3 Republicans. By our calculations, a more natural breakdown in Illinois would be 11 Democrats to 6 Republicans. This map gets an “F” from the Princeton Gerrymandering Project.
#3 and #2: Pennsylvania and Texas - 4 seats each
Until recently, the worst gerrymanders in modern history were able to squeeze out four seats for a party. That takes a large state, so it’s no surprise that these took place in Pennsylvania and Texas.
Pennsylvania’s 2012 map was part of the Great Gerrymander of 2012. In Pennsylvania, redistricting is done by the legislature and governor, and Republicans made full use of their single-party control. The resulting map elected 13 Republicans and 5 Democrats, which is pretty extreme in a state that routinely votes 50%-50%. By our metrics, this counts as a four-seat advantage.
Pennsylvania’s gerrymander will not be repeated, for two reasons. First, the state Supreme Court ruled that partisan gerrymandering violates the state constitution. As Ben Williams, Rick Ober, and I have reviewed, every state’s constitution has provisions that can be used for this purpose: requirements supporting freedom of association, equal justice under law, and free and fair elections. A few states have made use of those provisions.

The other gerrymander in this category was drawn by Democrats in Texas in 1992. This was, in some ways, the peak of Democratic influence over Texas redistricting.
Both Pennsylvania and Texas represent peak gerrymandering efforts by their respective parties, each managing to extract significant partisan advantage through sophisticated map manipulation.
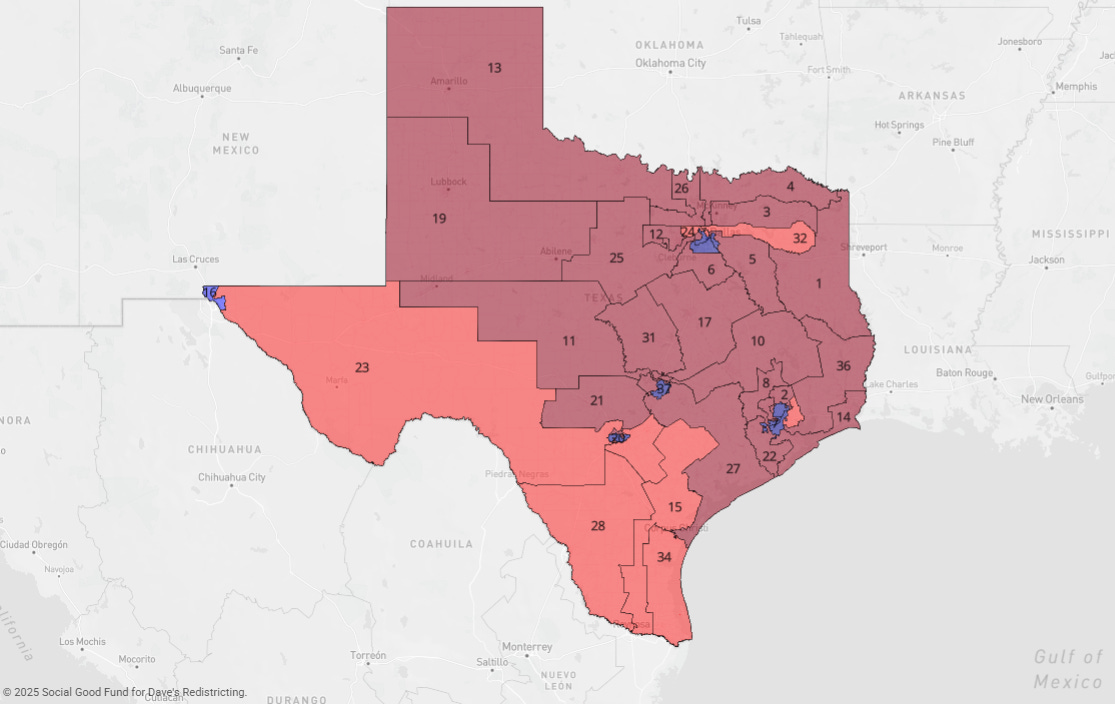
#1: The Texas Gerrymander of 2025 - up to 7 seats
Consistent with the enormous fuss that's been expended over the last month, the new Texas congressional map is indeed the worst gerrymander of the last 50 years. It's going to net Republicans an advantage of 3 to 5 seats. That’s on top of an already extreme partisan gerrymander that they enacted in 2021. The grand total is 5 to 7 additional seats above what a neutral process would produce.
This is simply phenomenal. It outstrips all other gerrymanders, including a variety of Republican offenses in 2012, as well as the 1982 Democratic offense in California and the current map in Illinois. The Texas gerrymander of 2025 stands alone as the most extreme manipulation of electoral boundaries in modern American history.
Now, how is it that Texas has been able to achieve such a dubious honor? The answer is simple: they are disregarding the Voting Rights Act. By ignoring the representational needs of Black and Hispanic populations, including coalition districts, they are able to eliminate districts in Dallas, Houston, and San Antonio. And if they get lucky in 2026, they may be able to eliminate two Hispanic-represented districts at the southern border that are currently held by Henry Cuellar and Vicente Gonzalez.
If this map stands, it will be because the Supreme Court is ready to discard what is left of the Voting Rights Act. And Texas’s record will enter the history books.
(Dis)honorable mention: The California draft plan, 5 seats
California’s draft plan, unveiled this week, is nearly as bad as Texas’s. Based on the same methods as those used above, the new plan adds an average of 4 Democratic seats above the current plan, which already has a 1-seat advantage. That leads to a total of a 5-seat advantage. This advantage is at the bottom of the range of what the new Texas plan will do.
If California voters pass it this November, which is a requirement of the constitutional process there, their state will join Texas as producing one of the two worst gerrymanders of the last 50 years

Note: In our analysis, we are leaving out a few other large deviations which appear to arise from vagaries of population patterns and the Voting Rights Act, including the 1982 Texas congressional map (which was drawn by a court) a map drawn under bipartisan control in Ohio in 1972, and a map drawn by the California Supreme Court in 1992. Other two-seat gerrymanders that fell by the wayside in our estimation include offenses in New Jersey, New York, and Wisconsin. There’s much more to say about these smaller offenses, but not today.
A rude comment (now deleted) made the incorrect claim that Massachusetts is gerrymandered because its map exceeds proportionality by 3 seats. This idea is totally wrong. (If it were just proportionality, then random Internet commenters could do what we did in this post.)
In a system of districts, proportionality is not guaranteed. The reason is that 51% of the vote wins 100% of a seat. At that point it depends on the exact distribution of district voting tendencies. That is why the Electoral Innovation Lab's approaches were needed.
In the particular case of Massachusetts, Ruth Buck, Moon Duchin, and coauthors have proved through extensive mathematical simulation that it is impossible to draw even one Republican-leaning district because Republicans are too evenly distributed. The article: https://www.liebertpub.com/doi/full/10.1089/elj.2018.0537
I don't want to be that guy, but:
The new Texas gerrymander was craftily designed to be quite VRA proof. The new 35th district is still majority Hispanic while they were able to make the new 9th district in Houston majority-Hispanic, so that there's actually one more majority-Hispanic district than in the original gerrymander.
The only majority-minority district that was broken up was Dallas' 32nd.